← All topics
Mapping & Visualization
Mapping & Visualization
6 posts
28 Apr 2026  25 Apr 2026
 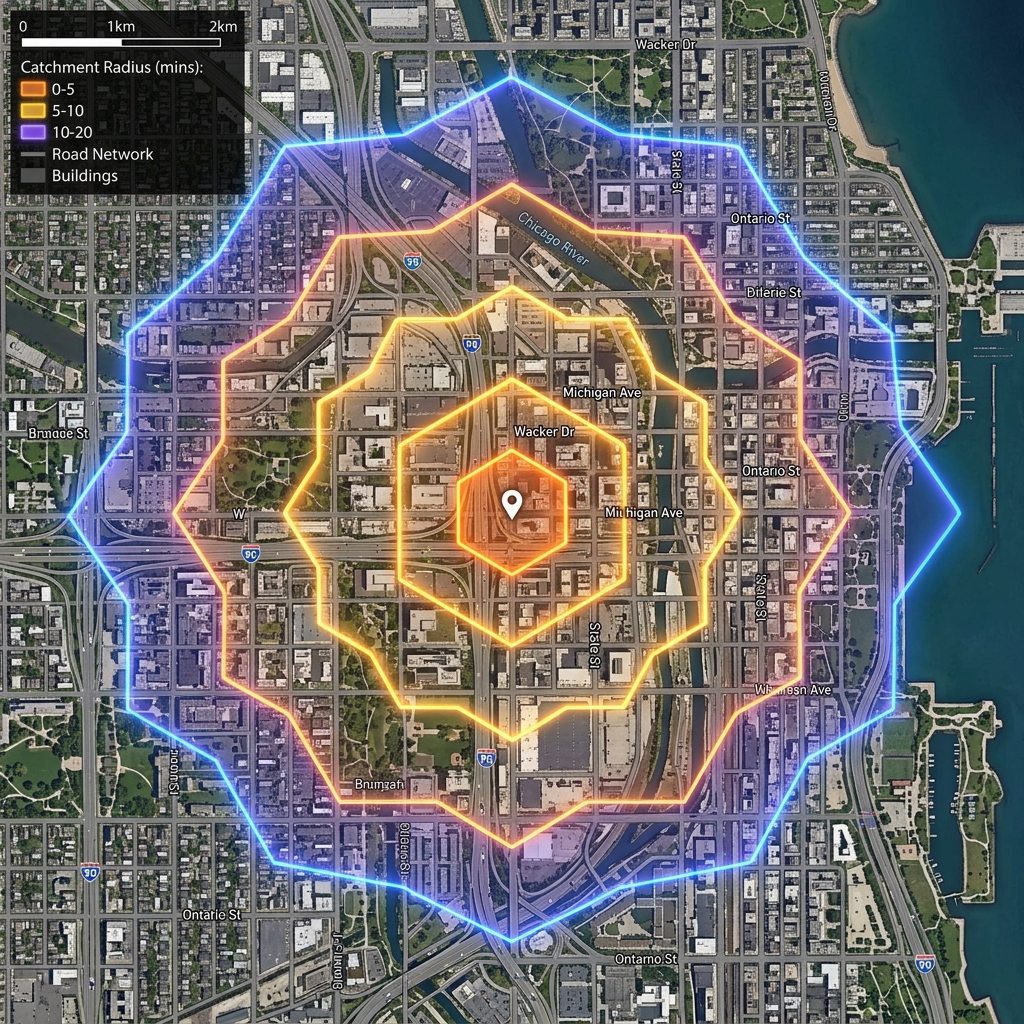 22 Apr 2026
  13 Sept 2025
  02 Sept 2025
  16 Aug 2025
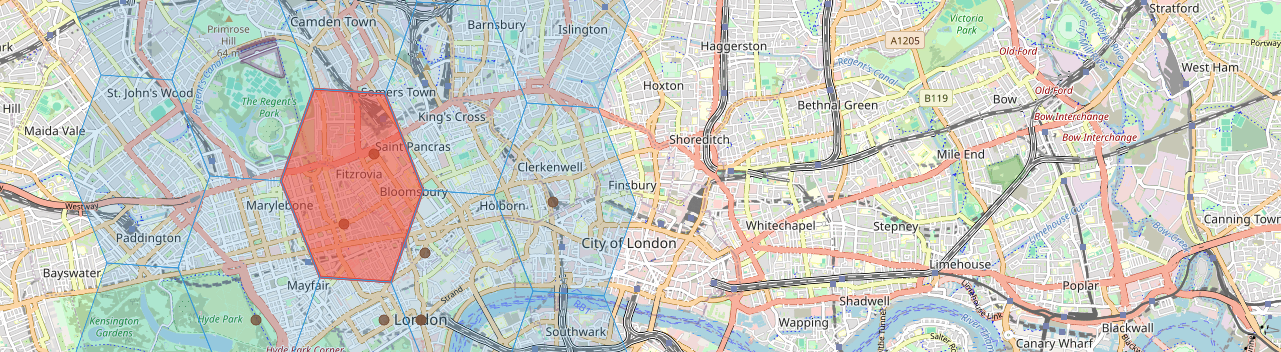
H3 Hierarchy and Compaction: Multi-Resolution Spatial Analysis
Learn how H3's hierarchical structure enables multi-resolution analysis, how parent-child relationships work across resolution levels, and how the compactCells and uncompactCells functions reduce redundant spatial representations. Includes interactive browser demos and practical code examples.
25 Apr 2026 H3 Catchment Analysis: Modelling Service Areas with Hexagonal Grids
Learn how to use H3's gridDisk, gridRing, and gridDistance functions to model service areas, accessibility zones, and multi-source catchment overlap. Includes interactive browser-based demos with step-by-step code.
22 Apr 2026 H3 Density Mapping: Visualising Urban Point Data as Hexagonal Heatmaps
Learn how to aggregate point data into hexagonal density maps using H3 and Leaflet. This tutorial covers spatial binning, choropleth colouring, power-scaled colour ramps, and interactive multi-resolution analysis — all running in the browser.
13 Sept 2025 Platial vs Spatial: Why the Distinction Matters
An extended reflection on the difference between the spatial and the platial, why it matters for data, design, and everyday life, and how embracing both can transform how we map the world.
02 Sept 2025 Platial Atlas: Mapping How People Experience Places
Discover how the Platial Atlas project proposes capturing and representing places as they are lived and perceived by communities, using the PlaceCrafter framework to move beyond conventional geographic boundaries.
16 Aug 2025 Getting Started with H3: The Hexagonal Grid System for Spatial Analysis
This hands-on tutorial introduces H3, Uber's open-source hexagonal grid system that's transforming spatial analysis. Learn why hexagons outperform traditional grids, set up H3 in JavaScript, and build interactive mapping applications with step-by-step code examples.